
Customer service analytics is how a company finds out why its customers need service, what that costs and what to change so they need less of it. Most programs stop at the first part and report activity, which tells you how busy the operation was and little about why.
What data does customer service analytics use?
Customer service analytics uses every record your service operation already produces. That means call recordings and transcripts, chat and email threads, cases and tickets, survey responses, QA scores, chatbot and voice-agent sessions, and workforce forecasts. Add enterprise data such as orders, shipments, product usage and account status, and you can tie a contact to the thing that caused it.
Most enterprises already have all of this. They have it spread across a CCaaS platform, a CRM, a QA tool, a survey tool and a WFM system, each with its own idea of what a customer is.
So the hard part is joining the data. Collecting it is easy. A call in the phone system, a chat two days later and a case update in the CRM are, from the customer’s side, one problem. Unless something links them, your analytics will count three.
Self-service sessions belong in the same join. Across self-service as a whole, Gartner found only 14% of customer service issues are fully resolved there (2024), so a self-service session is often only the first step of an experience. Analytics that stop at the bot’s own report never see what happened next.
What should customer service analytics measure?
Measure what the customer went through to get an issue resolved, across every contact, channel and day it took. Most programs measure the contact instead, because the contact is the unit the systems record.
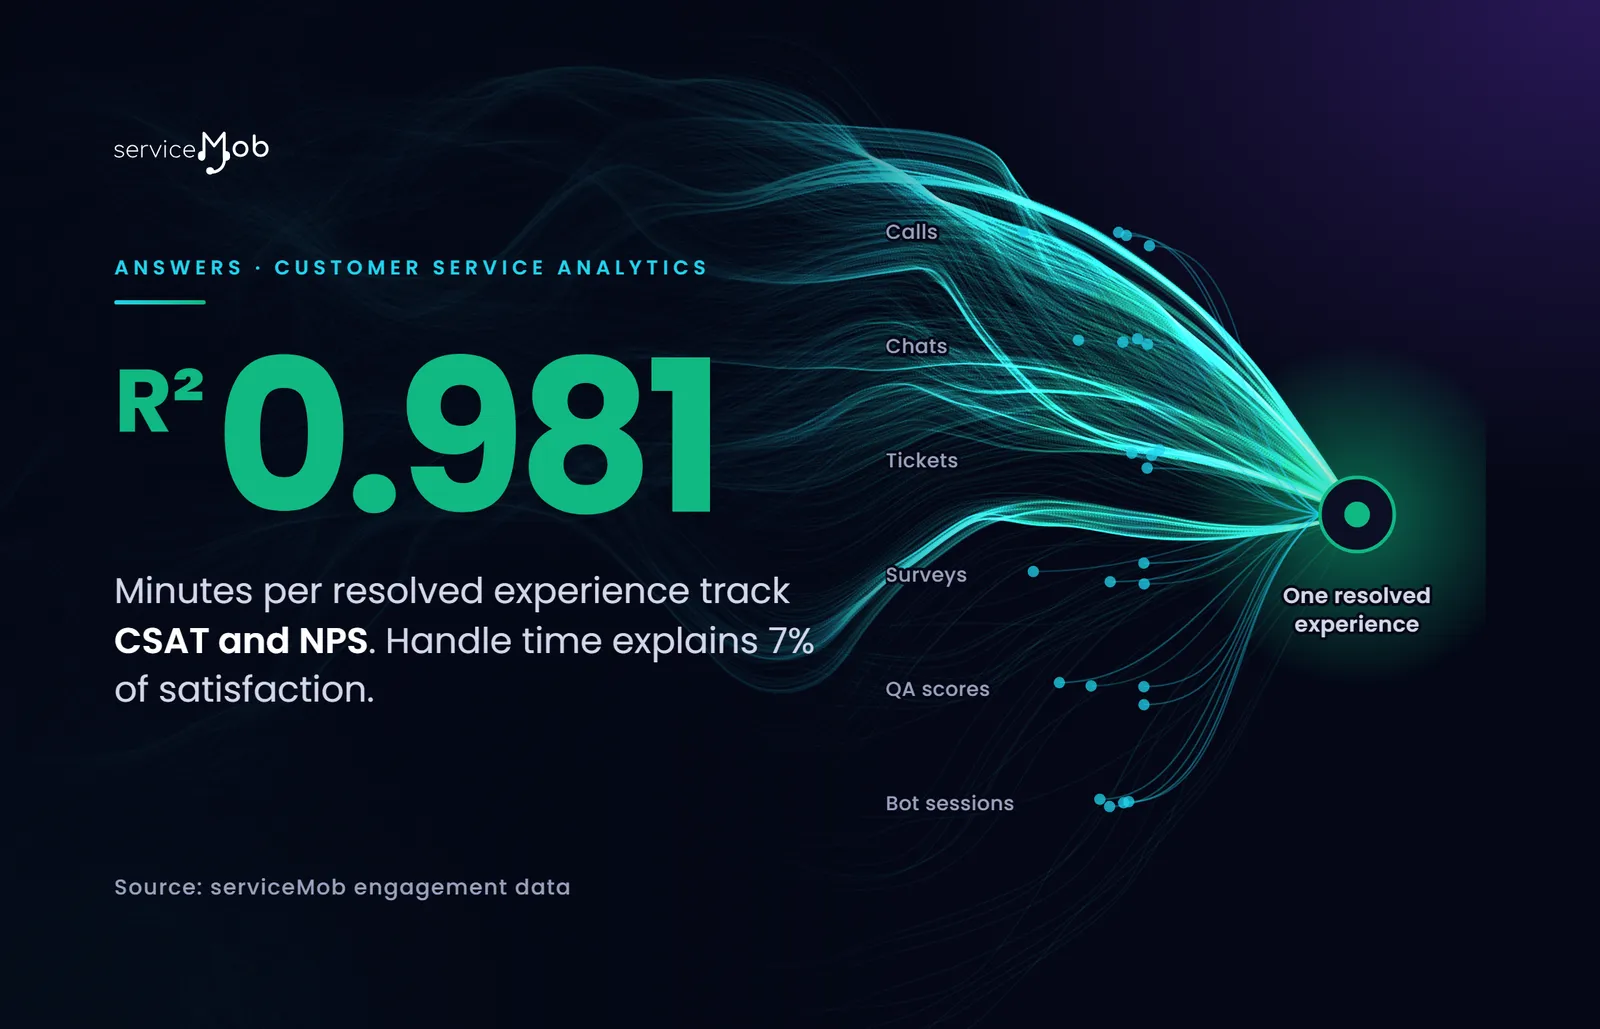
That choice decides what you can learn. In serviceMob engagement data, Average Handle Time tracks customer satisfaction at R² 0.0699, so it explains 7% of satisfaction. AMPRx, Average Minutes Per Resolved Experience, adds up the customer’s effort across every contact until the issue is truly resolved, and in the same data it tracks CSAT and NPS at R² 0.981. The gap between them is the subject of why handle time barely tracks satisfaction.
The companion measures count the other kinds of effort. CPRx counts contacts per resolved experience, APRx counts agents, DTRx counts calendar days, and 1CX Rate is the share of experiences resolved with no further contact, judged by what the customer did next and never by ticket closure. Satisfaction falls with every extra contact, and the curve from one contact to five shows by how much.
Picture one issue in one week. A parcel goes missing, and the customer gets in touch three times before it is found, with a different agent each time. The contact view shows three conversations with acceptable handle times and probably closed tickets. The experience view shows 3 contacts, 3 agents and 7 days to resolution, and a customer now deciding whether to stay.
Why aren’t CSAT and NPS surveys enough?
A survey tells you how the customers who answered felt, and nothing about what everyone else did. McKinsey found the typical CX survey samples only 7% of a company’s customers (2021).
Surveys are still worth running, as one input among several. Behavior is the census: every customer who called back, switched channels or gave up left a record, whether or not they filled in a form. Analytics built on that record are measured on 100% of behavioral data, including the customers who never answer a survey. Each of those behaviors has a metric, laid out in how companies measure customer effort.
What does customer service analytics change in the business?
The change that pays is lower demand. Analytics that only report give you faster reports about the same demand.
The first place it usually finds demand to remove is repeat contacts. In North American inbound call centers, 29% of customers have to call back about the same issue (SQM Group, 2022). Each repeat is a contact you pay for twice, about an issue the customer thought was settled.
Analytics that measure resolved experiences can rank the issue types behind those repeats and send each one to the team that causes it. In the programs we run, that team usually sits outside the contact center: shipping, product, the field team, a policy nobody has revisited. Contact demand starts in those business units, so the fix lives there too.
At a home services SaaS decacorn, that work cut the contact rate 78%. The demand prevention case walks through how the program ran.
How is it different from contact center reporting?
Contact center reporting tells you how the operation ran: volume, service level, handle time, occupancy. You need it to staff the floor. Customer service analytics should tell you why customers needed the operation in the first place, and which of those reasons you can remove.
One question shows which of the two you have. Ask your current tools how many customer experiences you had last week. If the answer comes back as a count of tickets, the experience isn’t modeled yet, and nothing built on top of those tools can measure effort per experience. Our guide to choosing a customer service analytics vendor sorts the categories by that question.
How do you get started?
Two exports are enough for a first look: your ticket or case data and your WFM forecast. Put side by side, they show the gap between what your contact metrics say and what your experience metrics reveal.
At serviceMob that work runs on the Brain. It models every service and support input, plus your enterprise data, as one connected record per customer experience, and a Forward Deployed team builds and runs it inside your operation. The definitions for every metric above are in the metrics glossary.
Questions
Is customer service analytics the same as contact center analytics?
They overlap. Contact center analytics usually means the operation's own numbers: volume, service level, handle time, occupancy and agent performance. Customer service analytics asks the wider question of why customers need service at all, which pulls in data from outside the contact center such as billing, orders and product usage. You need both, because they answer different questions.
What metrics does customer service analytics track?
Customer service analytics tracks two kinds of metric. Operational metrics describe the contact center: volume, service level, average handle time and occupancy. Experience metrics describe what the customer went through, counted per resolved experience: minutes of effort (AMPRx), contacts (CPRx), agents (APRx), days to resolution (DTRx) and the share resolved with no further contact (1CX Rate). The experience metrics are the ones that track satisfaction.
How is this different from putting a BI dashboard on our data?
A BI layer reports the outputs you already have, faster. Experience analytics first models the experience those outputs belong to, then computes effort metrics on it and tags each issue to the team that caused it. The modeling step is the difference, and it is most of the work.
Who outside the contact center uses customer service analytics?
The teams that cause the contacts. Once each issue type is tagged to the business unit behind it, billing, logistics, product and marketing each get a ranked list of what to change. Executives get a written account of what changed this period and why, and loyalty teams get churn signals drawn from service data.