
There are two ways to bring inbound volume down. You can make it harder to reach you, or you can remove the reasons customers need to. The first lowers the count and raises the customer’s effort. The second lowers both, and it’s the only one that lasts.
Why does deflection alone hurt the experience?
Deflection hurts when the deflected issue isn’t resolved, because the customer comes back through another door. Across self-service as a whole, only 14% of customer service issues are fully resolved there (Gartner, 2024). Even issues customers call very simple resolve fully in self-service only 36% of the time, in the same Gartner survey.
A containment rate that climbs while the issue stays open moves work from your payroll to the customer’s evening. The customer who failed in the app calls anyway, now with a longer story and less patience. Your report shows a win in one channel and an unexplained spike in another.
Self-service is still worth building, and customers use it: 73% of customers use self-service at some point in their service journey (Gartner, 2024). Build it to finish the job, and judge it by whether the experience resolved. A session that ended proves nothing.
Which contacts should you prevent, and which should you serve?
The contacts to prevent are the ones your own business created. The ones to serve carry value. The test: if every team upstream had done its job, would this customer still need to reach you?
Contacts that pass the test are demand you want. A customer weighing an upgrade, a customer about to leave, a problem that needs a person’s judgment, a complaint that tells product something it didn’t know. Cut those and you cut revenue and loyalty along with cost.
Contacts that fail it are demand you made. “Where is my order” because the tracking page is wrong. “When is the technician coming” because a field visit moved and nobody told the customer. A password reset because the self-service flow broke on one browser. Then there’s every second and third contact about an issue that should have been fixed the first time, the subject of reducing repeat contacts. Each contact after the first in an experience is avoidable by definition, which is why contacts per resolved experience (CPRx) is the demand multiplier.
Where does avoidable demand come from?
In the programs we run, avoidable demand usually starts outside the contact center: billing, product, shipping, field operations, the website and the app. Service sees the symptom. The cause sits in a team that never sees the contact.
Reason codes won’t show you this. An agent picks one disposition per contact, under time pressure, from a list built for reporting. Three contacts about one late delivery become three tickets with three codes, and none of them names the warehouse.
To find the source, model the experience. The Brain joins every contact across channels into one record per customer experience, maps it by point of view, channel and phase, and tags it to the business unit that caused it. Where a phase of the journey maps to no source system, the map shows that too, so you know which part of the journey you can’t see yet.
Then rank issue types by how many experiences they generate, how many contacts each one takes (CPRx), how many minutes of customer effort (AMPRx) and the churn risk that follows (PECs). The top of that list is where prevention pays first.
How do you get the owning team to fix the cause?
Owning teams act on a number about their own work, in their own terms. A product team that hears “customers are confused” will add a help article. A product team that sees how many experiences one release generated, the contacts and minutes each took and the churn risk attached will change the release.
Then close the loop from service. When the upstream fix ships, CPRx and volume for that issue type should fall. If they don’t, the fix missed, and you find out within the period instead of at the annual review. Our Data Journals record what changed each period, where and why, per business unit, so the team that caused the demand sees the result of its own change.
How do you know the experience improved while volume fell?
The experience improved if effort per resolved experience falls along with volume. If contacts fall and AMPRx and CPRx fall with them, you prevented demand. If contacts fall while effort per experience holds or rises, you pushed work onto customers, and it will surface later as churn.
Effort is the right guardrail because it tracks satisfaction. In serviceMob engagement data, AMPRx correlates with CSAT and NPS at R² 0.981. Handle time can’t, and the AHT correlation shows why.
Survey scores can’t do it alone either. McKinsey found the typical CX survey samples only 7% of a company’s customers (2021), and a survey sent after a contact never reaches the customer who gave up before making one. Watch DTRx, days to resolved experience, as well. An issue that resolves on the third try shows up there even when every single contact looked short.
What does demand prevention look like in practice?
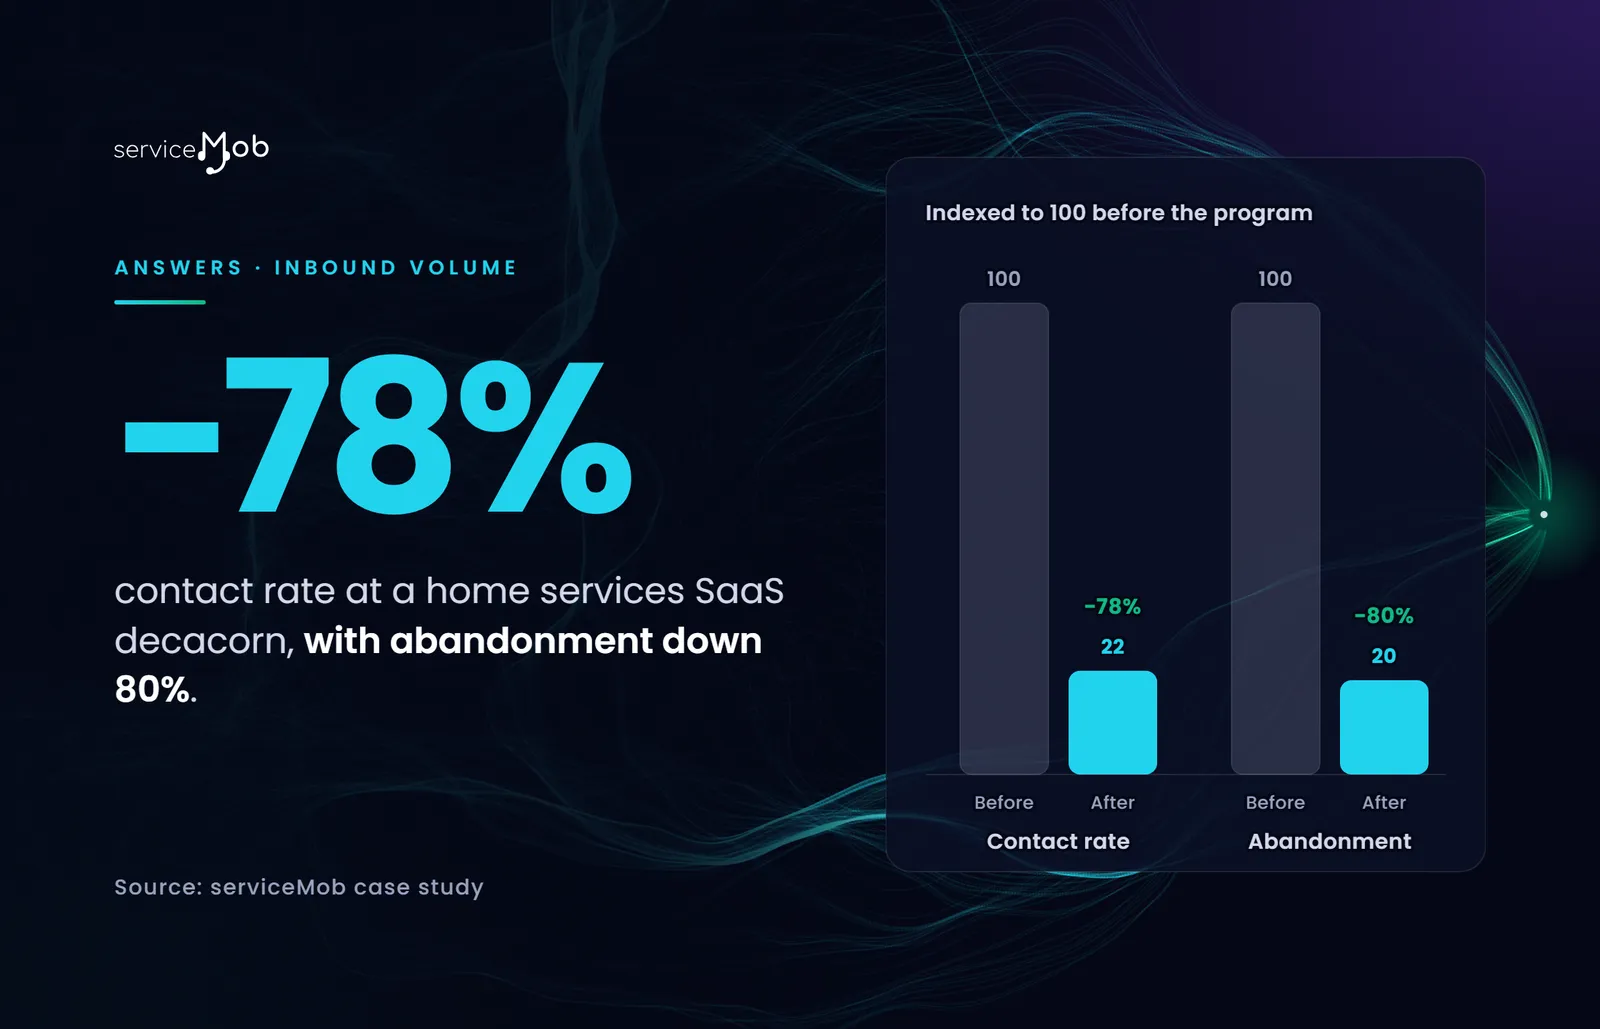
At a home services SaaS decacorn, demand prevention cut the contact rate 78% and abandonment 80%, once every experience was modeled and the issue types behind repeat demand were worked one by one.
Before the program, queues were burning, repeat contacts were known only through anecdote, negative sentiment was reaching social channels and nobody could predict contact demand.
We put experiential metrics, CPRx and AMPRx among them, on every interaction and built one connected record per customer experience across phone and chat. That let the team rank the issue types behind repeat demand and work through them.
Contacts per customer went from 3.2 to 1.8 on the phone and from 3.5 to 1.9 on chat. The program took $13M out of cost and reduced the need for 60 FTE.
Abandonment is the number to look at twice. Volume fell, and the customers who still called gave up far less often. With fewer avoidable calls in the queue, the ones that needed a person got through.
The full case is on the use cases page.
Questions
Should you hide the phone number to cut call volume?
No. Hiding the number lowers the count you report and raises the effort customers spend. The issue still needs fixing, so it arrives later through another channel or as a cancellation. Remove the reasons to call, and keep the number easy to find for the demand you want to serve.
Does demand prevention mean cutting agents?
It lowers the hours you need to staff. For the home services SaaS decacorn, the program reduced the need for 60 FTE. Where the freed capacity goes is a management decision, and the demand worth serving, such as complex issues and customers at risk, is the obvious place to put it.
What data do you need to start modeling avoidable demand?
Contact records from every channel that can be tied to a customer, plus the enterprise data that explains why they got in touch: orders, billing, shipments, field visits, product releases. Most enterprises already hold all of it in separate systems.