The Brain for Customer Service & Support
Model the Experience. Not the Contact.
serviceMob renders the customer experience as structured data, so your teams prevent demand instead of handling it. Delivered through Forward Deployed Engineers who ship with the software.
-
$100M+
delivered to client bottom lines
-
R² 0.981
AMPRx tracks satisfaction. Handle time explains 7%.
-
98.3%
forecast accuracy for a healthcare unicorn
Sound familiar?
Tired of piles of cases and tickets?
You have every tool. A CRM, a CCaaS platform, QA, workforce management, dashboards, voice agents and automation. And you still take thousands of contacts, day in and day out.
Voice agents handle contact demand. They do not solve it. Cases and tickets end up in piles of redundant data no one uses.
Why? No one is modeling the entire customer experience as a data model.
serviceMob does.
The Franken-Stack of service data
Every tool is a chapter. None of them is the book.
Click a category to see what it does well, what it produces, and what none of them can see. Then assemble the stack and watch every output become an input to the Brain.
-
- Talkdesk
-

-

-

- Amazon Connect
-
-

- ServiceNow
- Microsoft Dynamics 365
- SAP
- Pega
-
-
- Medallia
- Qualtrics
-

- SurveyMonkey
-
-

- Calabrio
-

-

-

- Verint
-
-
-

-

- Forethought
-

-
-
- Tableau
- Domo
- Looker
-

- Power BI
CCaaS
Routes and records every call and chat, at scale, with the telephony reliability the floor depends on.
Produces A contact record and a recording.
Missing Which experience the contact belongs to, and whether it will come back.
CRM
Holds the customer, the case and the history the agent needs on screen.
Produces A case, opened and closed.
Missing How many contacts the case really took, across every channel.
Sentiment and NPS
Asks customers how they felt and turns the answers into scores leaders trust.
Produces A survey response from the few who answer.
Missing The behavior of the 95% who never answer.
WFM and QA
Forecasts volume, builds schedules and grades a sample of conversations.
Produces A forecast, a schedule and a QA score.
Missing The repeat demand hiding inside the volume, and the experiences behind the sampled calls.
AI support agents
Handle contact demand around the clock, in every language, at a fraction of the cost per minute.
Produces A deflected or handled contact.
Missing Whether the issue was resolved, or came back through another channel.
Data visualization and BI
Puts every output on one screen, sliced any way the business asks.
Produces A dashboard of the outputs above.
Missing A model of the experience the outputs add up to.
The Brain for Customer Service & Support


Every output above becomes an input. The experience becomes the record.
- Provides the quantified customer experiences you delivered
- Tells you how to model the data of service from the customer's perspective
- Measures 100% of the experiences with direct correlation to churn, NPS and CSAT
- Extensible data model for other business units to consume and action service data
Pick a category to see what it produces, then assemble the stack.
Trademarks belong to their respective owners.
The executive layer
What changed this period, where, and why.
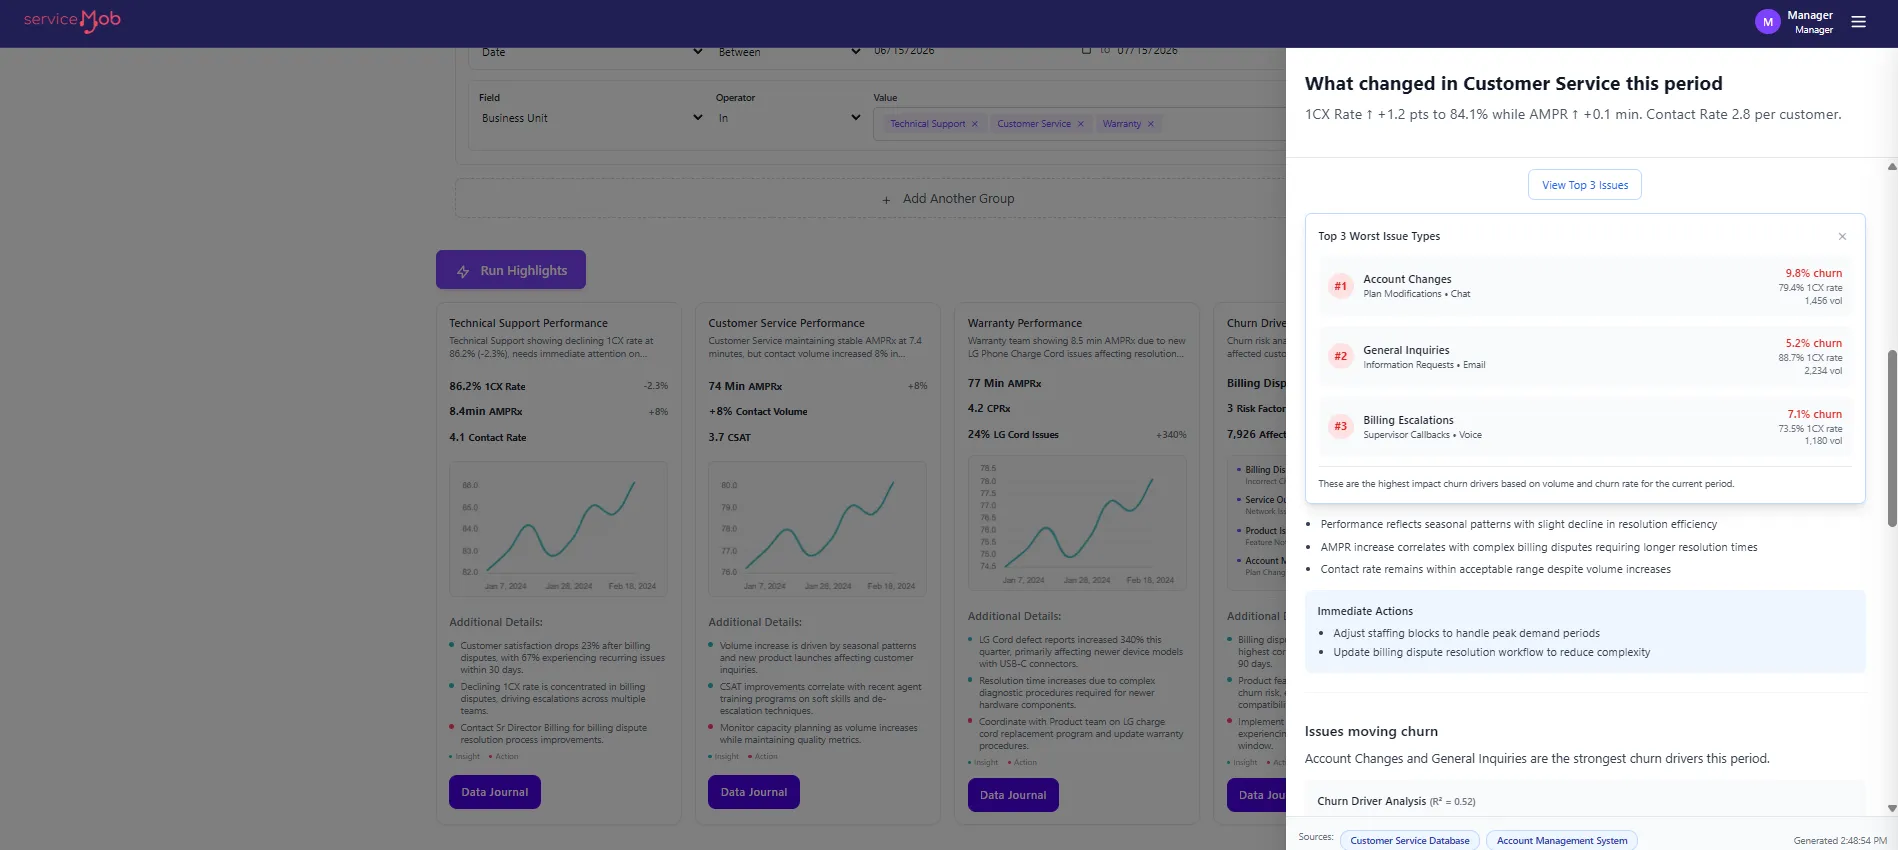
Run Highlights and Data Journals record what changed this period, where and why, per business unit. Leaders read the narrative in place of hunting through a dashboard for it.
mobAI answers the questions leaders ask of the data in plain language, with drill-downs to the issue type, the team and the agent.
The top issue types arrive ranked by churn, so the business units causing contacts know what to change to prevent them.
Why the experience, not the contact
The head of support could see every contact and none of the experiences behind them.
-
Problem
The head of support at a home services software company had a dashboard for every channel. Volume, handle time and first-contact resolution, reported daily. Contact rate stayed high anyway, and nothing on the screen said which customer experiences were generating the next call.
-
Complication
Contact data is a record of interruptions. A customer who calls three times about one problem shows up as three tickets closed on time, three acceptable handle times and one quiet churn risk. Optimizing the contact hides the experience that caused it.
-
Solution
serviceMob modeled each customer's experience as one connected record across phone and chat and measured it with experiential metrics: contacts per resolved experience, minutes per resolved experience, chat concurrency. The issue types behind repeat demand could be ranked and worked, and the teams received a queue of experiences to fix in place of a report to read.
-
Value
Contact rate fell 78%. Abandonment fell 80%. Contacts per customer went from 3.2 to 1.8 on the phone and from 3.5 to 1.9 on chat. The program deflected $13M in cost and reduced the need for 60 FTE. The full story is in the Home Services SaaS Decacorn case.
The metric problem
Average Handle Time explains 7% of satisfaction.
For decades the industry optimized how fast a contact ends. serviceMob measures how many minutes it takes to resolve an experience, AMPRx, and that number tracks satisfaction. Handle time barely registers.
-
R² 0.981
AMPRx to CSAT and NPS
Average Minutes Per Resolved Experience
-
R² 0.0699
Average Handle Time to CSAT
Explains 7% of satisfaction
Products
One Brain. Four ways to act on the experience.
-
Core
The Brain and Answer Engine
The Experiential Answer Engine turns every interaction into structured, connected experience data and answers the questions leaders ask of it.
-
Coaching
Agentic Performance Management
Coaching grounded in experience data: which issues each agent is not resolving, compared with peers, with the talk tracks that close the gap.
-
Voice
Ontological Voice Agents
Voice AI trained on your experience ontology, so it resolves the reason for the call and feeds what it learns back into the model.
-
Workforce
WFMaaS
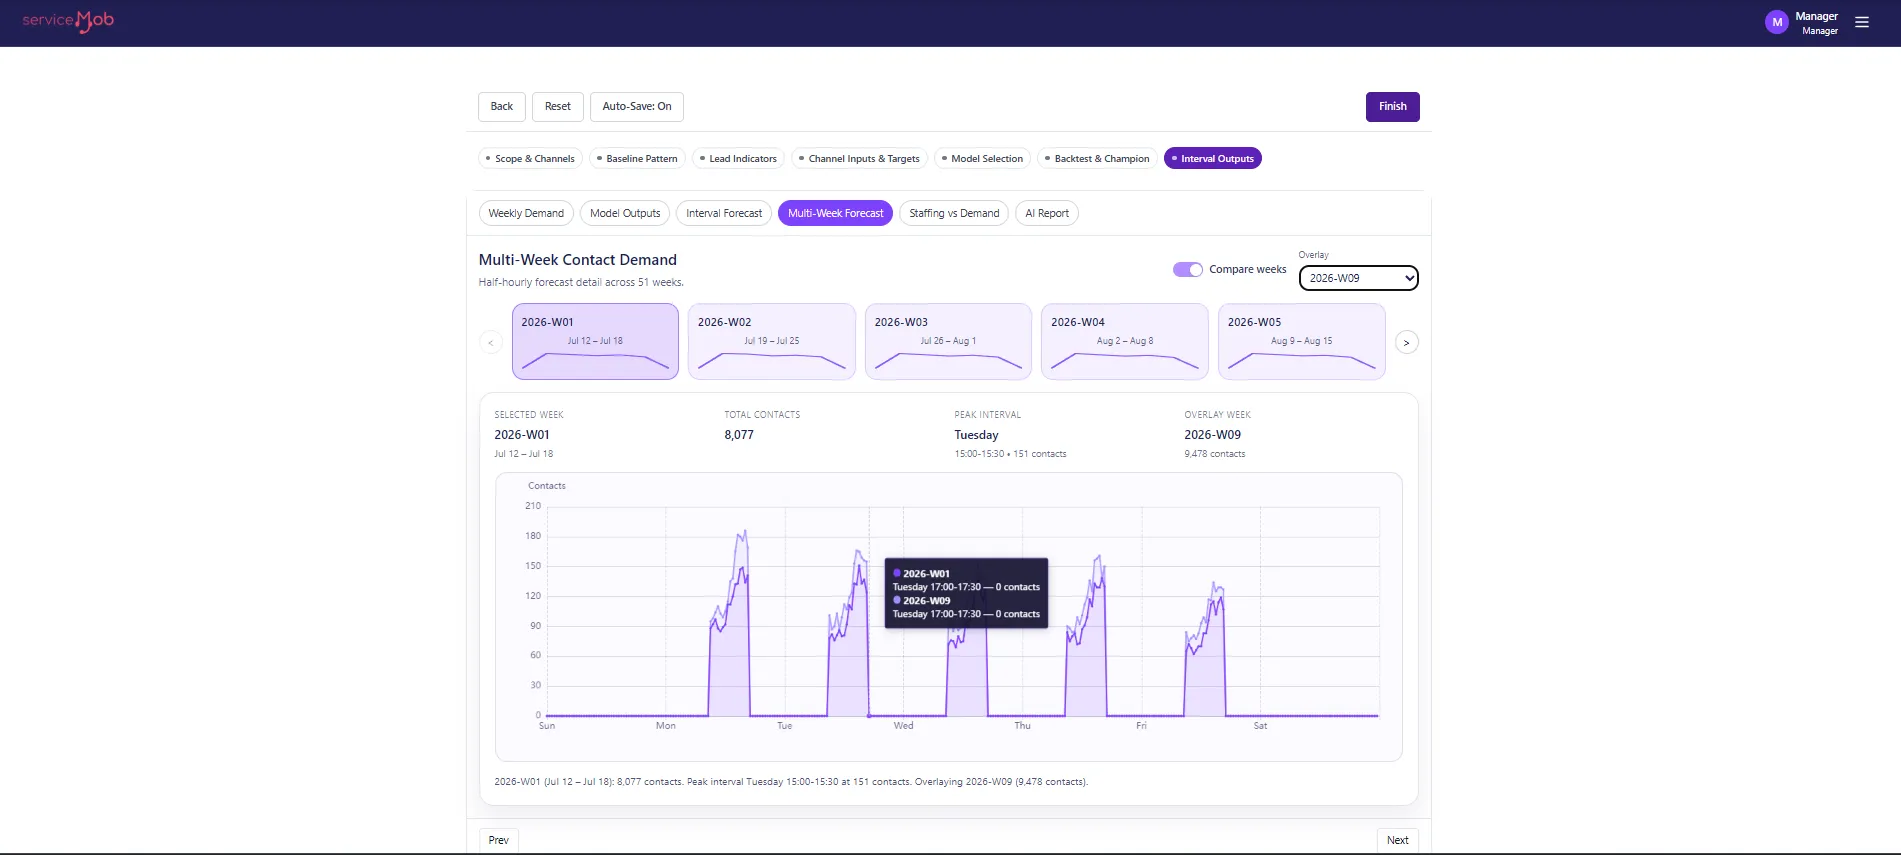
Forecasting, scheduling, adherence and intraday management run as a service, with Forecasting as a Service predicting demand from experiential signals at 15-minute intervals.
How we deliver
An AI-Native Services company. The people ship with the software.
serviceMob is an AINS company: the model, the experience ontology and the people who operate them arrive together. Forward Deployed Engineers, Forward Deployed Strategists, Forward Deployed Data Scientists and subject matter experts work inside your operation from the first week.
- Strategy: model the experience and the demand it creates.
- Operationalize: put the Brain in front of the teams that cause and handle demand.
- Transform: move the business units that cause contacts.
- Delivery: run it with you, with pricing set in your proposal.
You buy the engagement. Licenses meter it.
Proof
Returns from the experience, by industry.
-
Travel/Hospitality Company
Around 230 excess FTEs identified. Resolution time down 52% on voice, 36% on chat and 54% on SMS.
-
Home Services SaaS Decacorn
Contact rate down 78%, abandonment down 80%, $13M in cost deflection and a 60 FTE reduction.
-
Healthcare Unicorn
98.3% forecast accuracy at 15-minute intervals, occupancy up 30%, abandonment down 70%, 110 FTE.
Questions
What people ask before a working session.
What is the Brain for Customer Service & Support?
The Brain is serviceMob's Experiential Answer Engine. It models every customer's experience as one connected record across channels, teams and time, computes the metrics that predict satisfaction and demand, and answers questions about them in plain language through mobAI.
What is AMPRx?
Average Minutes Per Resolved Experience: the minutes of effort it takes to resolve a customer's experience, counted across every contact it generated. It tracks CSAT and NPS at R² 0.981. Average Handle Time tracks them at R² 0.0699 and explains 7% of satisfaction.
What does AI-Native Services mean?
An AINS company delivers the model and the people who operate it as one service. serviceMob's engagements start from context, build the experience ontology, extract the signals that predict demand, and apply judgment so what ships gets used. The Forward Deployed team stays inside the operation.
How is serviceMob priced?
Per active agent, per FTE or per minute depending on the product, with the figure set in your proposal.
Contact demand is a derivative of your business.
A working session is a conversation with a Forward Deployed Strategist about what is driving demand, margin and churn in your operation, and what the Brain would model first.