
Why serviceMob
If your analytics was working, you would have less contact demand. You would know how many customer experiences you had last week — not just how many calls came in. You would know which issues cause repeat contacts, what they cost, and what to fix first. The fact that most enterprises cannot answer these questions is the problem we exist to solve.
The Failure of Traditional Metrics
Customer service runs on metrics designed to optimize handling — not to prevent demand. AHT measures how long a call lasted. It does not measure how long it took the enterprise to resolve the customer’s problem. CSAT captures perception from 5% of interactions via survey. It does not measure behavioral effort across 100% of experiences.
What Traditional Metrics Cannot See
FCR (First Contact Resolution) measures ticket closure. It does not track whether the customer called back, chatted, emailed, and called again to resolve the same issue. These metrics explain what happened on the phone. They do not explain why demand exists.

Experience Metrics Replace Operational Metrics
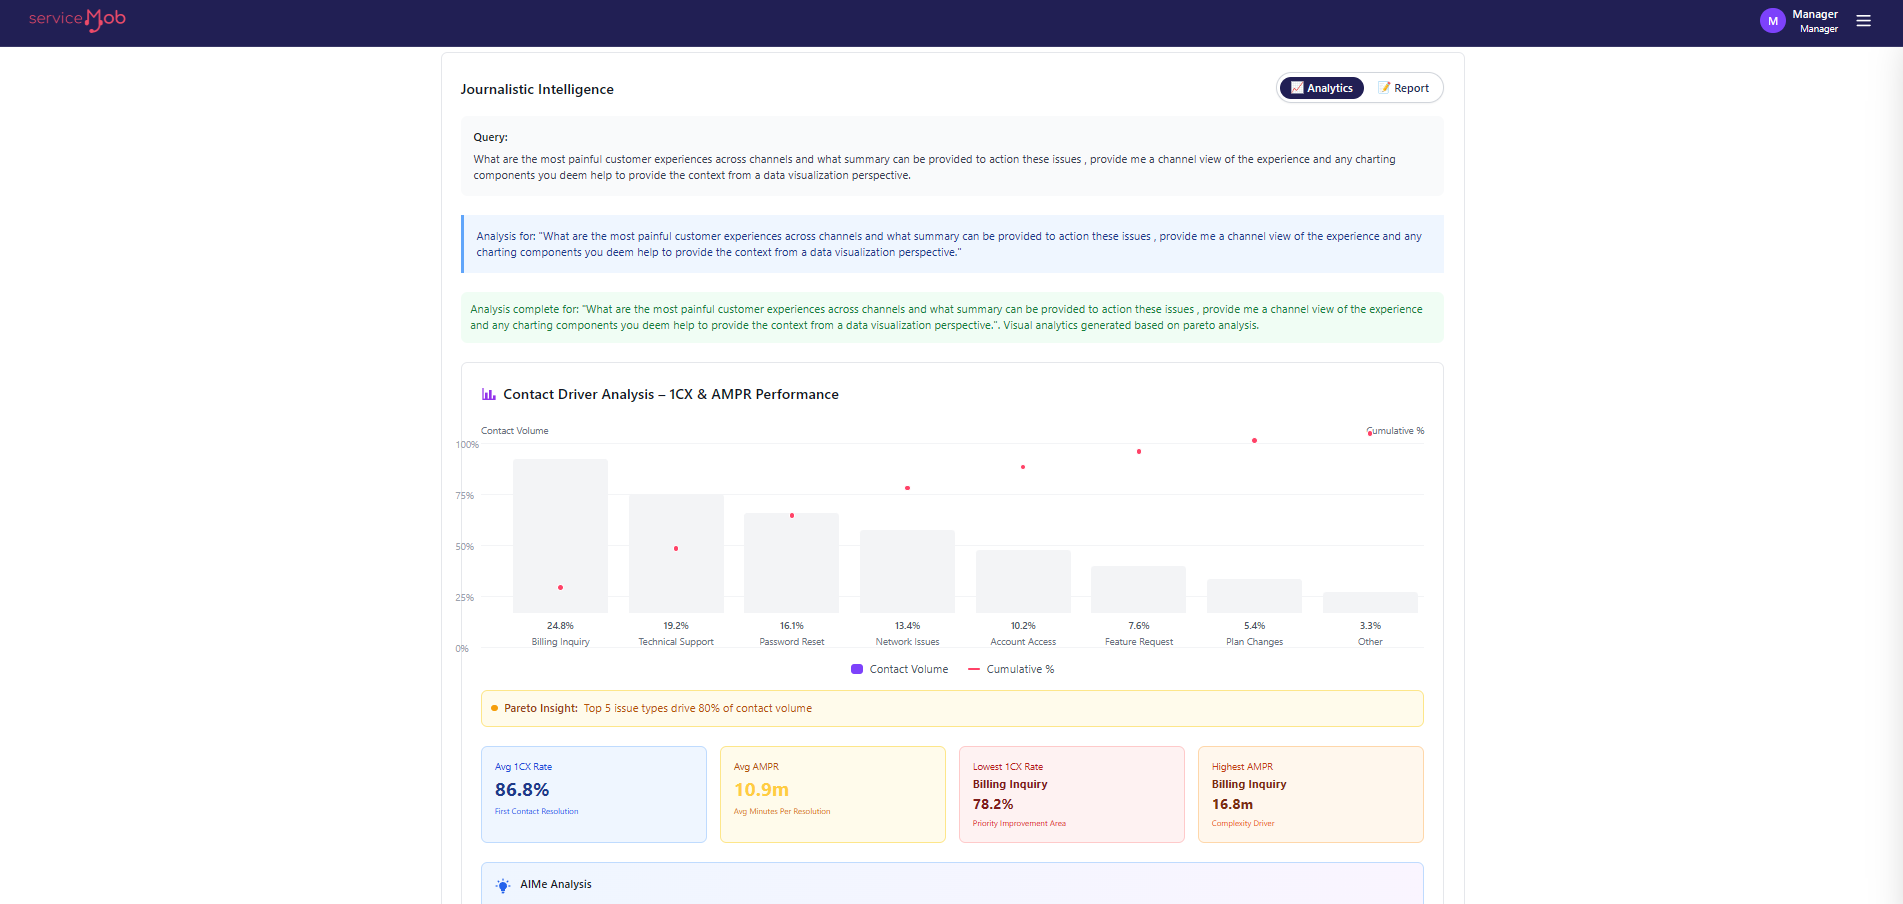
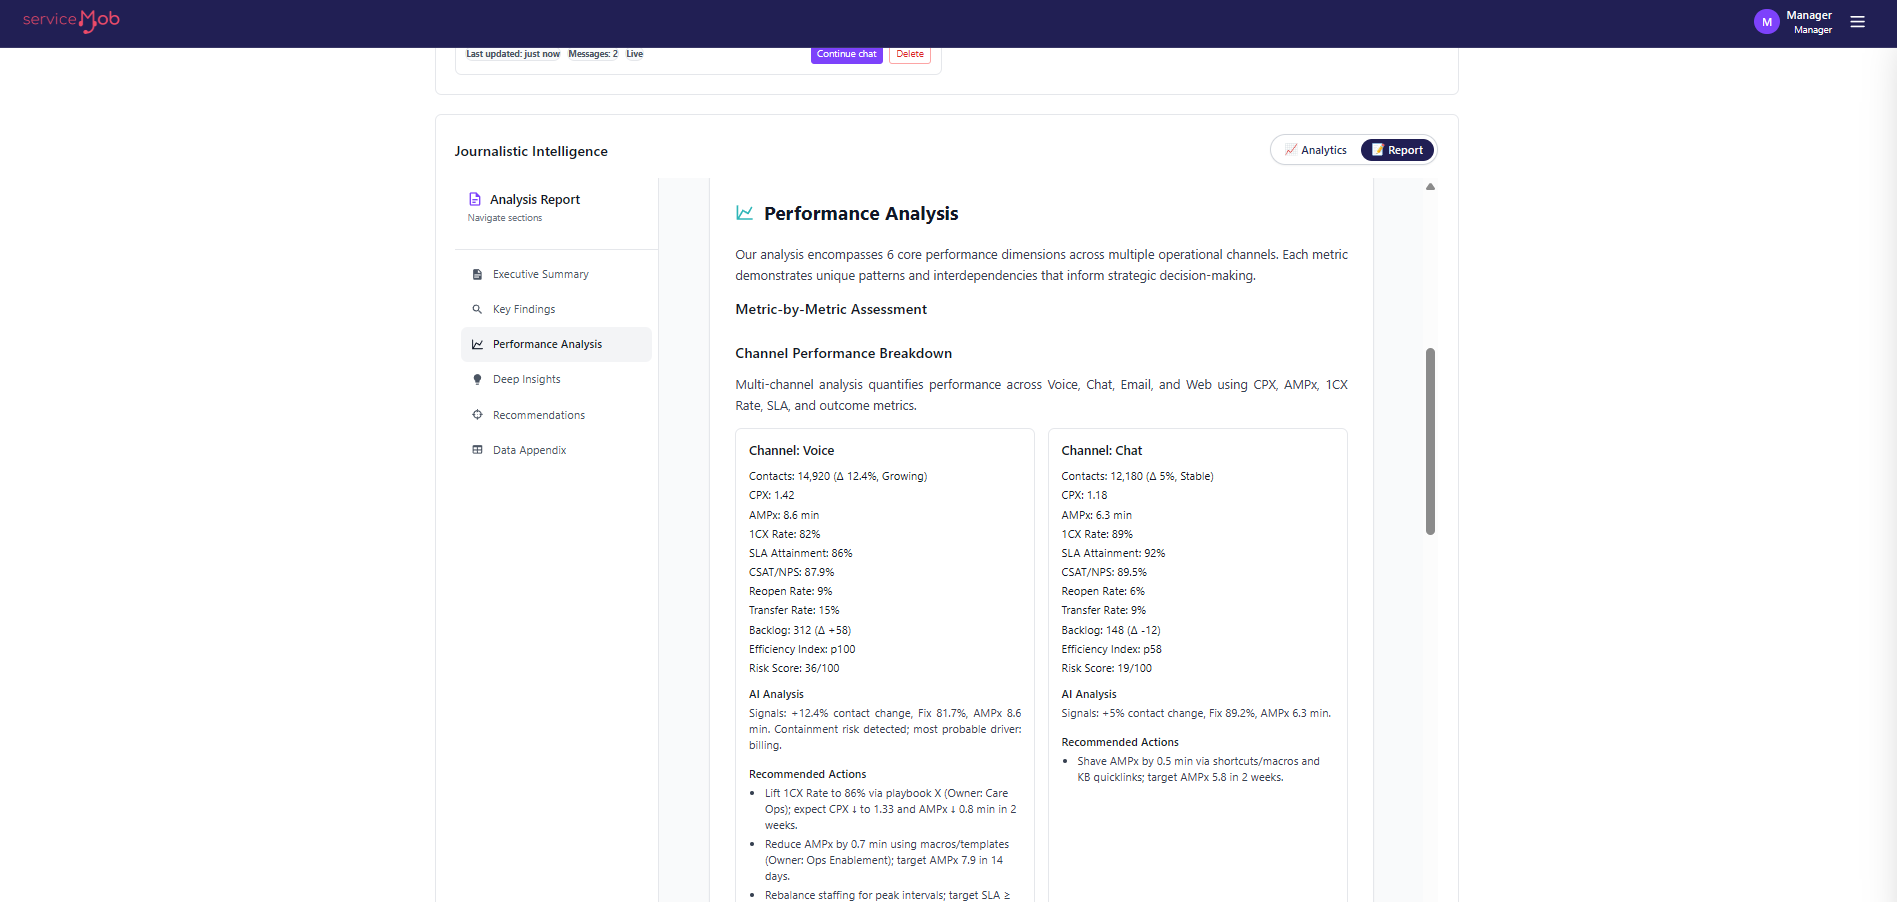
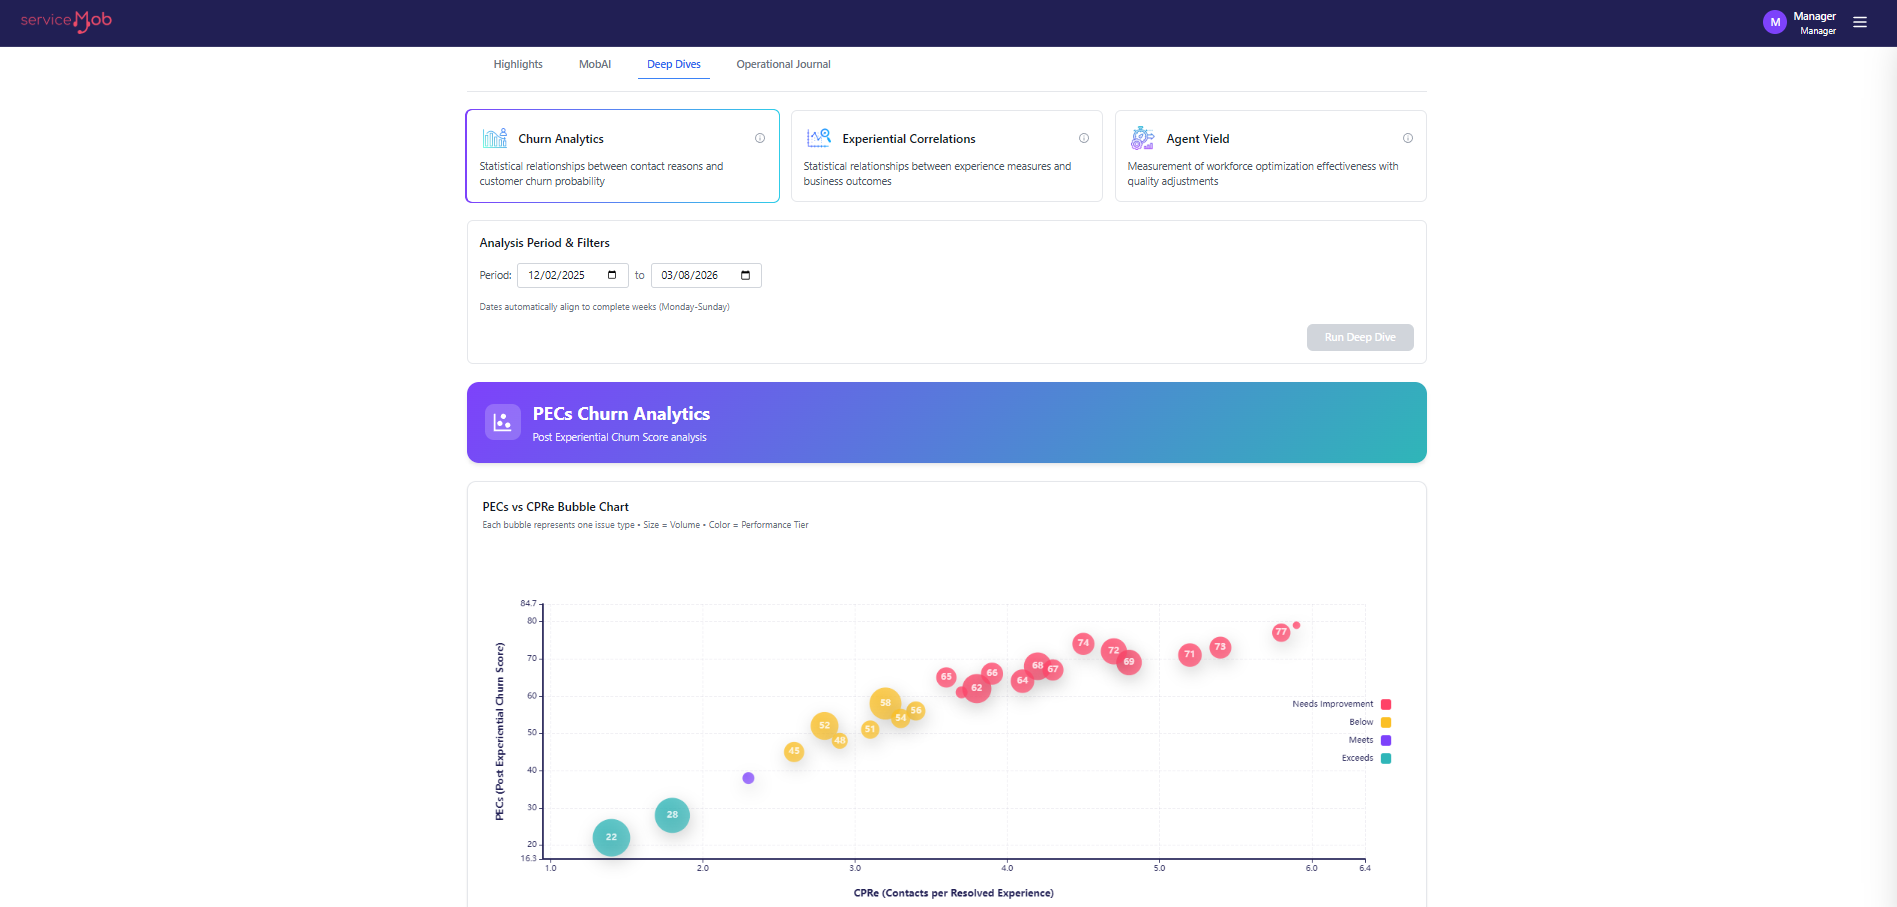
serviceMob replaces AHT, CSAT, and FCR with behavioral experience metrics measured on 100% of interactions — not survey samples. CPx (Contacts Per Resolved Experience) measures how many times a customer had to come back. Reducing CPx from 2.4 to 1.6 across 500,000 annual experiences eliminates 400,000+ contacts. AMPRx (Average Minutes Per Resolved Experience) measures total agent time invested per resolved intention — showing up to 98% correlation with CSAT. 1CX Rate (One-Experience Resolution) measures what percentage of experiences resolve in a single contact, replacing Fix Rate which ignores cross-channel re-entry.
When CPx increases, AMPRx increases, forecast error grows, staffing inflates, cost per experience rises, and churn probability climbs. When 1CX increases, the opposite happens — contact demand declines, gross margin improves, and the enterprise gets answers instead of reports. This is not analytics. This is causal modeling.
The Executive Translation
Executives do not need dashboards. They need answers: What is driving repeat demand? What experiences cost the most? What should we fix first? How many agents can we avoid hiring? CPx is the demand multiplier. AMPRx is the cost per experience. 1CX is the structural containment rate. These metrics power those answers.
Ontology — The Missing Infrastructure
Experience metrics require an experience model. You cannot measure CPx or AMPRx without first modeling what a “resolved experience” looks like — across every channel, every contact reason, and every resolution path. This is why most platforms cannot do what serviceMob does. They measure contacts. We model experiences.
If you cannot answer ‘How many customer experiences did we have last week, and which ones should we prioritize?’ — you do not have an ontology. You have a reporting gap.
The Data Ontology
serviceMob builds a prescriptive data ontology for each client — a structured framework that maps every customer experience across POV → Channel → Phase → Component → Actor → Resolution. Every interaction is modeled as an experience object. If a value does not exist, the ontology exposes NULL conditions — revealing structural data gaps the business cannot see. NULLs are not missing data. NULLs are the deployment plan.

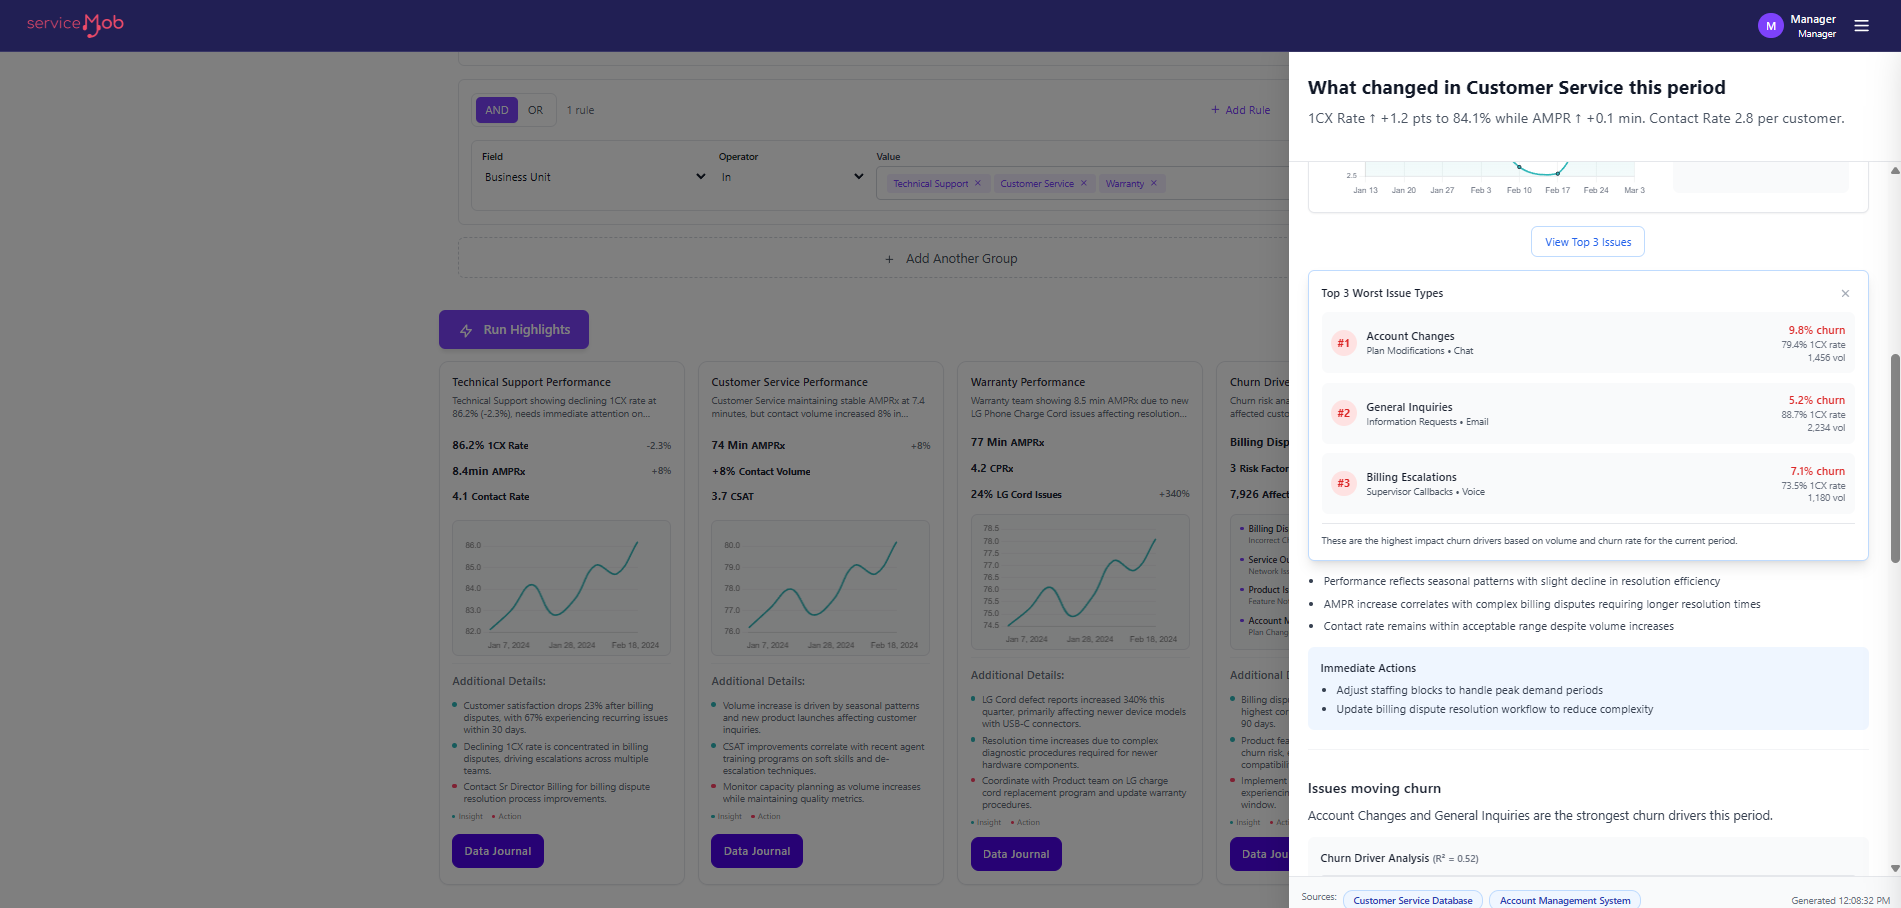
Once experiences are modeled as structured data, the Answer Engine can quantify 100% of customer experiences (not survey samples), identify the root cause drivers of repeat demand, rank issues by pain, prevalence, and cost, prescribe what to fix, where, and why, and feed experiential signals to forecasting, coaching, and enterprise distribution.
Ontology Is Not a Feature — It Is the Foundation
Every serviceMob deployment begins with building the client’s experience ontology. Forward Deployed Engineers (FDEs) embed in the operation, learn the business, and construct the ontology from your actual data — CRM, telephony, chat, WFM, ticketing, case management, and any other system in the stack. This is not a plug-and-play dashboard. This is infrastructure that makes the Answer Engine possible.
FDEs do not just configure software. They learn your operation, map your data ecosystem, and build the ontology that turns fragmented service data into a unified experience model — one that makes prevention, forecasting, and enterprise signal distribution possible.
What This Enables
When you model experiences as data, measure effort behaviorally, and build the ontology that connects service demand to enterprise root causes — everything changes.
Enterprise Outcomes
The Answer Engine transforms service operations from cost centers into intelligence engines — preventing demand, improving forecasting, and distributing insights that reduce contact volume at the source.
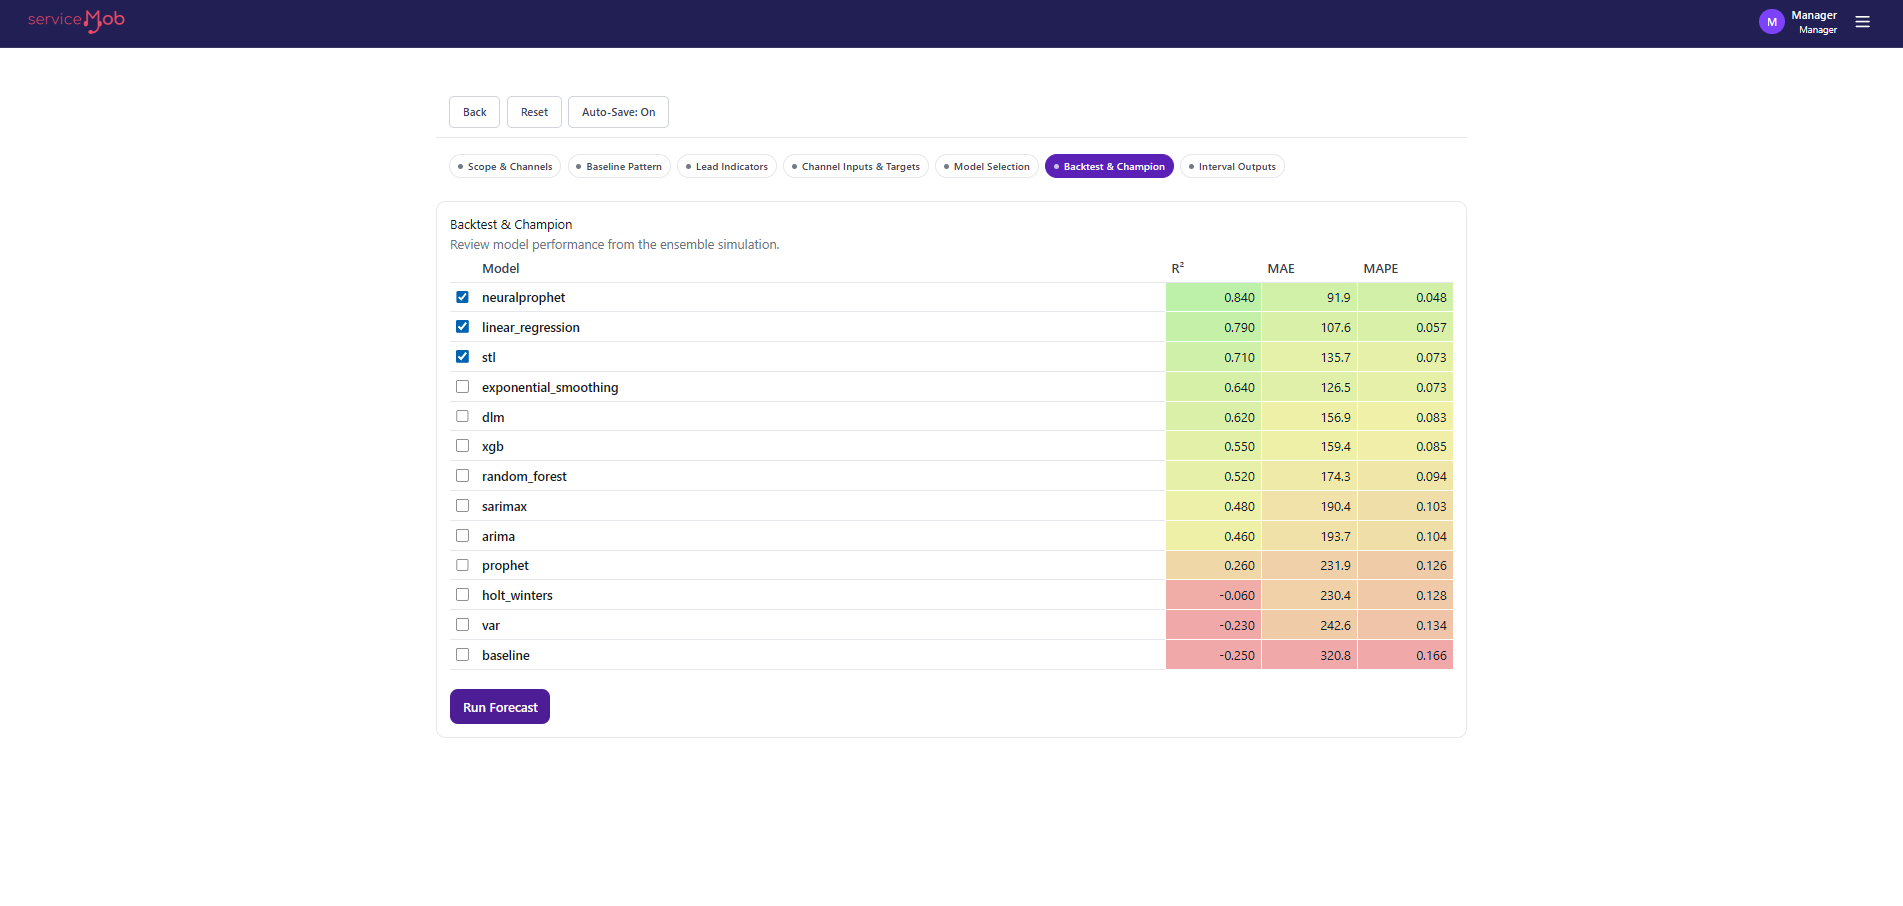
Demand Prevention: Identify the repeat demand loops that inflate contact volume — and prescribe what to fix upstream. Clients have achieved 40-50% reduction in contacts per resolved experience (CPx). Experiential Forecasting: Forecast experiences — not just contacts. The Answer Engine includes repeat contact signals in the forecast model, achieving 98%+ accuracy at 15-minute intervals.
Root Cause Clarity and Enterprise Signal Distribution
Proven at Scale: $75M+ in operational savings delivered. 40-50% contacts per resolution reduction. 22%+ cost per contact reduction. 18%+ NPS improvement. 98%+ forecasting accuracy. 110+ FTE reduction in a single healthcare enterprise case study.
How We Deploy — Software with a Service (SWaS)
serviceMob is not a self-serve dashboard you install and hope works. We deliver through Software with a Service (SWaS) — our platform combined with Forward Deployed Engineers (FDEs) who embed in your operation.
Why FDEs?
Service data is fragmented across CRM, telephony, chat, WFM, ticketing, case management, and homegrown systems. No two enterprises have the same stack, the same routing logic, or the same data gaps. Building the experience ontology requires subject-matter expertise — not a configuration wizard.
The 30/60/90-Day Engagement Arc
Days 1–30: Ontology Build. FDEs embed in the operation. Map data sources. Build the experience ontology (POV × Channel × Phase × Component). Expose NULL conditions. Deliver the gap plan. Days 30–60: Metrics Baseline + First Answers. Deploy CPx, AMPRx, 1CX, DTRx baselines. Identify top repeat demand drivers. Deliver prescriptive actions.
Days 60–90: Forecasting + Enterprise Distribution. Activate experiential forecasting. Connect demand drivers to upstream business units. Operationalize dashboards, coaching tools, and executive reporting. Ongoing: As systems, processes, and products change — FDEs iterate the ontology to keep the Answer Engine current.
Ready to Measure What Matters?
If you have 500+ agents, multi-channel support, repeat demand you cannot explain, and fragmented systems that do not talk to each other — we can quantify what is driving demand in weeks, not quarters.
Book a Working Session. Bring two exports: your ticket/case data and your WFM forecast. We will show you the delta between what your contact metrics say and what your experience metrics reveal.

