
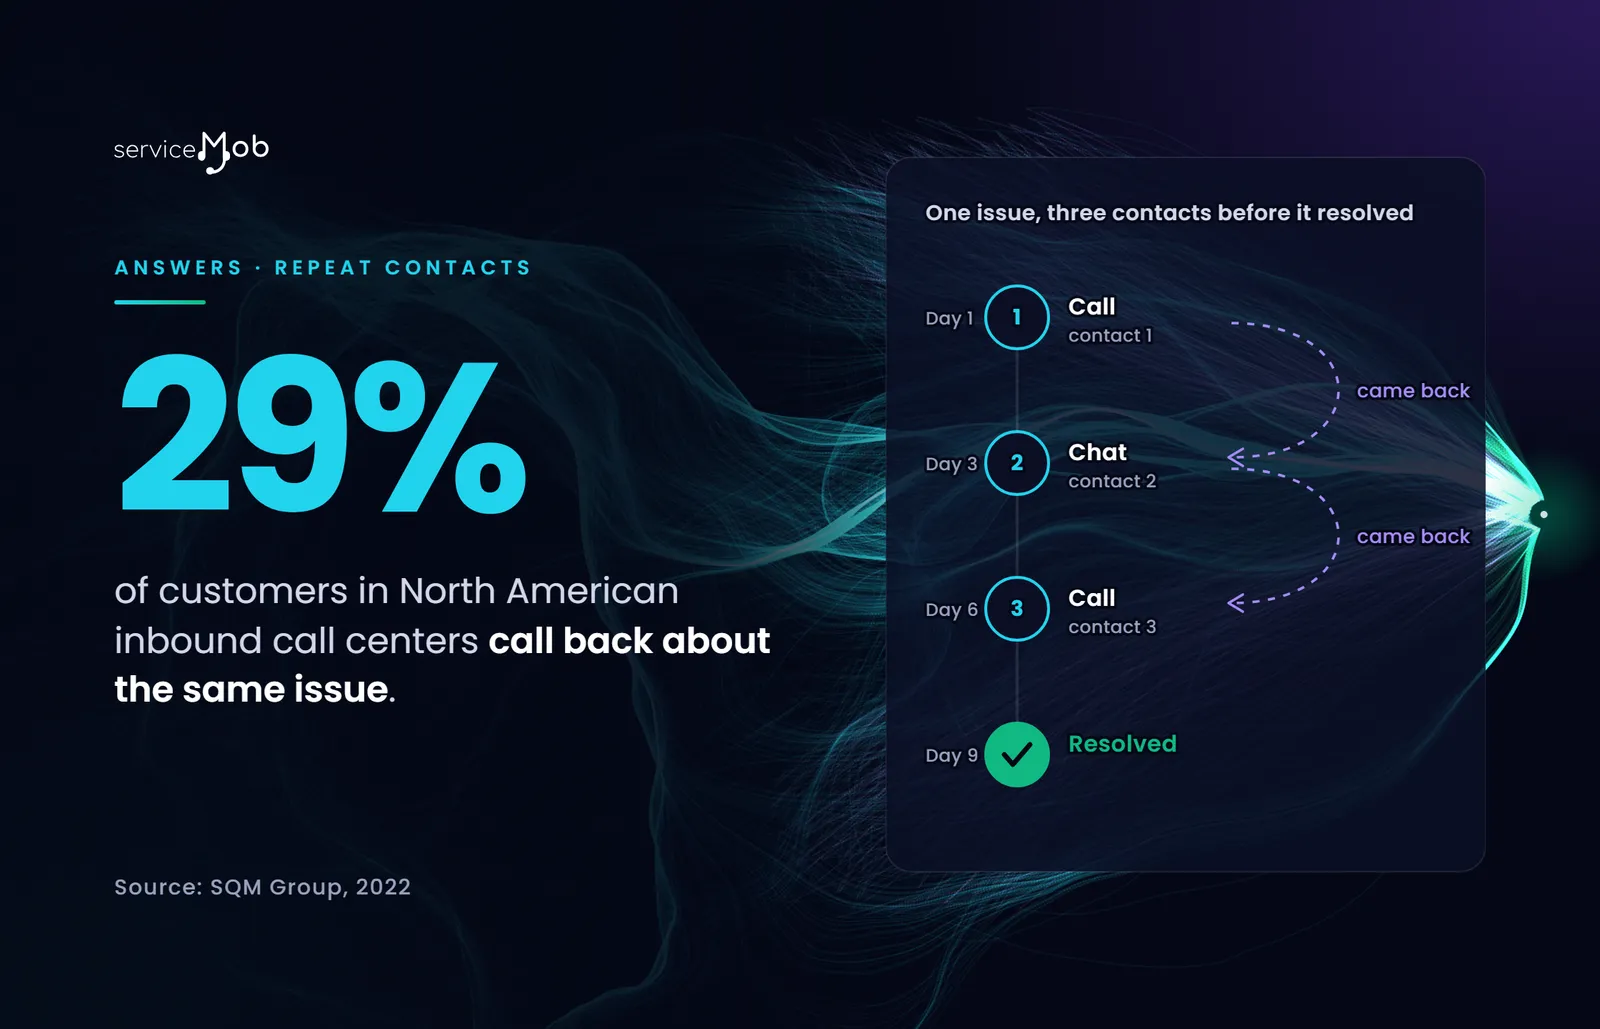
A repeat contact is a customer coming back about an issue you already handled once. It is the most expensive contact you take, because you paid for the first one and it didn’t work.
Most programs go after it at the agent, with shorter calls and a first contact resolution target on the scorecard. That seldom moves the number, because in the programs we run, the agent is rarely the reason the customer came back.
Why do customers contact you again about the same issue?
Customers contact you again about the same issue because the experience didn’t resolve, even though the contact closed. The ticket says solved. Meanwhile the refund was promised and never issued, the technician never got the dispatch, the bot sent a help article that didn’t cover the case, or the fix depended on a team the agent can’t reach.
Call speed isn’t the cause either. The handle time and satisfaction data shows how little a shorter call does for a customer whose issue is still open, and a rushed call can make the next one more likely.
How common are repeat contacts?
SQM Group’s 2022 benchmark of North American inbound call centers puts average first call resolution at 71%, so 29% of customers have to call back about the same issue. At a single operation, McKinsey described a US energy producer whose $200 million-a-year call center found about 20% of calls were repeats (2019).
Those two numbers measure different things. SQM’s is a share of customers, from post-call surveys, on the phone. McKinsey’s is a share of calls at one company. Neither counts the customer who called once, then opened a chat, then sent an email. Your own figure across every channel is the one you need, and most operations don’t have it.
Why doesn’t first contact resolution show you where repeats come from?
At best, first contact resolution tells you how many repeats you have. It says nothing about which issues cause them or where they start, and both common ways of measuring it lose the experience.
Ticket-based FCR trusts closure. The agent marks the case resolved, the customer comes back two days later on chat, and the chat opens a new ticket with its own clean FCR. Survey-based FCR asks the customer, which is better, but McKinsey found the typical CX survey samples only 7% of a company’s customers (2021). Everyone else leaves no answer. Neither version counts the outbound call an agent made to finish the job, which is why we use bi-directional FCR.
The goal behind FCR is sound. In SQM Group’s benchmark of North American inbound call centers, every 1% improvement in first call resolution brings a 1% improvement in customer satisfaction. What has to change is how you measure it.
How do you find your repeat contacts?
Finding repeat contacts takes one record per customer experience and a count of the contacts each one took to resolve. Join every contact to the customer and the issue: phone, chat, email, messaging, bot and voice-agent sessions, inbound and outbound.
The count is CPRx, contacts per resolved experience, and every contact after the first is repeat demand. Its mirror is 1CX Rate, the share of experiences resolved with no further contact, judged by what the customer did next instead of by ticket status. AMPRx adds the minutes those contacts cost the customer.
Cut CPRx by issue type, channel, agent, team and the business unit that caused the issue. The ranking that comes out is your work list: which experiences generate the most repeat demand, and where each one starts.
The count has to cover every experience. A repeat pattern confined to one product line or one region rarely shows up in a survey sample, and it is obvious in a full census. That census is what the Brain builds: one connected record per customer experience, across channels, teams and time.
What actually reduces repeat contacts?
Fixing the cause reduces repeat contacts, and the cause sits in one of two places.
When it sits upstream, in a billing error, a late delivery, a product defect or a policy customers misread, service can’t answer its way out. Send the experience data to the team that owns the cause, with the contacts and minutes it costs attached. A billing team that sees tickets will triage tickets. A billing team that sees how many customers needed several contacts to get one invoice corrected will fix the invoice. Preventing inbound demand covers how to get the owning team to act, with a full case.
When it sits in service, it is usually a specific issue type that specific agents don’t resolve. Coach to that, per agent and per issue type, against peers. Agentic Performance Management ranks each agent’s 1CX Rate by issue type against the team, attaches the talk tracks of the agents who do resolve it, and grades human and AI agents on the same scale.
Automation needs the same discipline. A voice bot that ends the call without fixing the issue moves the repeat to another channel, where it arrives angrier and costs more. A global supply-chain and logistics enterprise had exactly that problem with generic, deflection-first voice AI. With voice agents trained on its own experience data and measured on resolution, it found $5.8M in repeat-contact reduction alone, with $15.4M in reach across the program.
The tactics most guides recommend, such as callbacks, routing to the last agent and virtual queues, make a repeat contact easier to handle. They’re worth having. The contact still happens.
What happens to satisfaction when repeats fall?
Satisfaction rises as repeat contacts fall, because both come from the same unresolved experiences. SQM Group reports that customer satisfaction drops 15% for every additional call a customer has to make (2022).
Our own data points the same way. In serviceMob engagement data, NPS falls from 54.2 at one contact to 22.2 at five or more (linear fit, R² 0.998), and CSAT falls from 83.9 to 58.2 (R² 0.985). Experiences that resolve in fewer contacts sit higher on both curves.
The retention stakes are larger. Only 14% of customers who have a high-effort service interaction say they are likely to keep doing business with the company (Gartner, 2024).
Where do you start?
Pull last quarter’s contacts from every channel and try to join them to customers and issues. Then count how many issues took more than one contact. If you can’t make the join, that is your first finding: the data that shows repeat demand already sits in your systems, and nothing connects it.
Questions
Does an outbound callback count as a repeat contact?
Yes. CPRx counts every contact an experience needed, inbound and outbound, on every channel. Traditional first contact resolution credits an issue closed by an agent's callback as resolved on first contact. Bi-directional FCR (BD-FCR) does not, because the customer still needed a second contact to get the issue fixed.
Should AI agents be measured on repeat contacts too?
Yes, on the same scale as people. When a voice or chat agent closes the session and the customer comes back on another channel, the bot created a repeat contact. Agentic Performance Management grades human and AI agents on 1CX Rate, CPRx and AMPRx alike, so containment that doesn't resolve shows up as what it is.
Who should own repeat contact reduction?
Service owns the measurement. The fix belongs to whichever team causes the issue, and that is often billing, product, shipping or field operations. Tag each issue type to the business unit that causes it and report its CPRx to that unit, so the owner sees the demand it creates.
Is there a benchmark for a good repeat contact rate?
Not one that covers every channel. SQM Group's benchmark, for North American inbound call centers, is phone-only and built on post-call surveys. Your own CPRx across all channels, tracked by issue type over time, is the baseline that matters.