
Ask a service leader how the company measures customer effort and the answer is usually a survey question sent after a contact. Ask what customers actually had to do to get an issue fixed, how many times they got in touch and how many days it took, and the answer tends to come slower. That second record exists for every customer, and it sits scattered across several systems.
What is a Customer Effort Score?
A Customer Effort Score is a survey rating of how easy or hard a customer found it to get an issue handled, collected after a service interaction. Customer Effort Score was introduced in “Stop Trying to Delight Your Customers” (Harvard Business Review, 2010), by Dixon, Freeman and Toman, from a study of more than 75,000 people using contact centers or self-service, as a better predictor of loyalty than satisfaction or Net Promoter Score.
Companies report it either as an average rating or as the share of respondents who said the interaction was easy. The question wording and the scale vary from company to company, which is why CES numbers rarely compare across businesses.
Why does customer effort matter?
Customer effort matters because it predicts whether customers stay. Gartner (2020) found that customers who have a low-effort service experience “are 61% more likely to stay with the company,” and that a high-effort experience “drops that probability to only 37%.”
Gartner’s later research is blunter. Only 14% of customers who have a high-effort service interaction say they are likely to keep doing business with the company (Gartner, 2024).
If effort predicts retention, effort is an operating number. It has to be measured on the customers who are about to leave, and a survey can’t promise to reach them.
What are the limits of an effort survey?
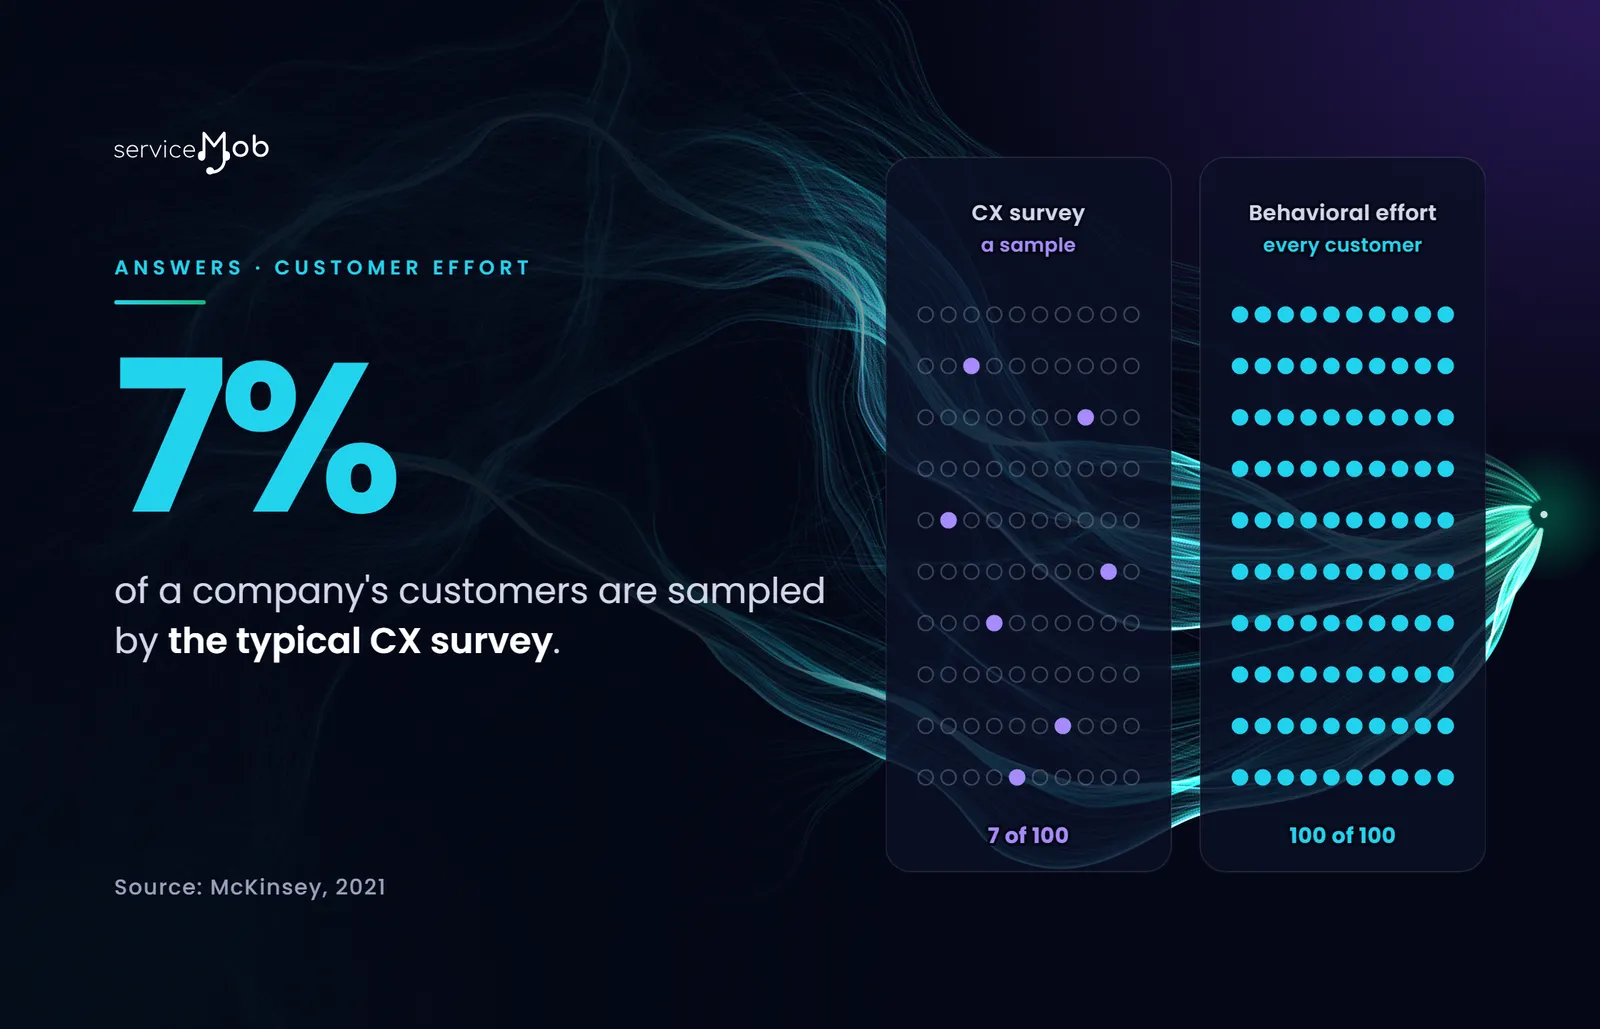
Reach and timing limit every effort survey: it hears only from the customers who answer, and only about the moment it asks about. McKinsey found the typical CX survey samples only 7% of a company’s customers (2021). That is a share of customers, not of interactions.
Companies run on these numbers anyway. In the same research, 93% of CX leaders McKinsey surveyed use a survey-based metric as their primary CX measure; 15% were fully satisfied with how they measure CX (2021).
Timing is the less obvious gap. A CES survey sent after a contact rates that contact. If a customer needed several contacts to resolve one issue, the early surveys rate conversations that hadn’t fixed anything, and the customer who gave up on chat and phoned instead may never be asked about the chat at all.
A score also can’t say where the effort came from. A bad CES tells you the customer struggled. It doesn’t tell you whether it was the transfer to the returns desk, the second identity check or the days spent waiting for a callback that never came.
What operational data shows customer effort?
Transfers, repeat contacts, channel switching and the time it takes to reach resolution are the behavioral signs of effort. That is the standard list, and it is the right one. The trouble is where those signals usually get counted.
Transfers sit in the telephony platform. Repeat contacts sit in the CRM, if the agent linked the cases. Channel switches fall between systems: the chat that failed and became a call is two records in two tools. Time to resolution is usually time to ticket closure, which stops when the agent closes the case, whether or not the customer still needs help.
Counted that way, each signal is a per-contact or per-ticket number, and none of them adds up to how hard the customer’s experience was. To measure effort from behavior, you have to join every contact a customer made about one issue, across channels and over time, into one experience. After that join, the signals become measurable per customer.
How does serviceMob measure effort on every customer?
Every proxy above has a serviceMob metric, computed per resolved experience for every customer who contacts service:
- Time to resolution is DTRx, Days To Resolved Experience: the calendar days from the first contact about an issue to its resolution.
- Repeat contacts and channel switches are CPRx, Contacts Per Resolved Experience: the distinct contacts across all channels, inbound and outbound, that the experience required before it was resolved.
- Transfers are APRx, Agents Per Resolved Experience: the number of distinct agents the customer dealt with.
- Total effort is AMPRx, Average Minutes Per Resolved Experience: the minutes it took to resolve the experience, counted across every contact it generated, on every channel.
- Whether the customer had to come back at all is the 1CX Rate, One-Contact Experience Rate: the share of experiences resolved with no additional contact, observed in what the customer did next, never from ticket closure.
These behavioral numbers move with what surveyed customers say. In serviceMob engagement data, AMPRx tracks CSAT and NPS at R² 0.981, far above the handle time correlation. The difference from a survey is coverage. The survey speaks for the customers it sampled. AMPRx is computed for all of them, including the ones who never answered a survey.
Those silent customers are where Gartner’s retention findings bite. PECs, Post-Experience Churn signals, correlate contact reasons and experience effort with subsequent churn, so the business can see which experiences cost it customers, not only contacts.
All of this runs in serviceMob’s Brain, which models each customer’s experience as one connected record across channels, teams and time. Without that record, the proxies stay scattered across the systems that logged them.
Should you keep the CES survey?
Yes, as a check on the behavioral metrics, while you manage the operation on behavior. The survey captures how the effort felt, and some effort only shows up there: a confusing policy, an agent who sounded rushed. Behavior shows how much effort there was and where it happened, for every customer.
Use the survey to confirm that the behavioral metrics move with what your customers report. Then run the operation on the behavioral ones, because they break down by issue type, agent and channel, and they trace back to the team whose process caused the contact.
Questions
Is average handle time a measure of customer effort?
No. Handle time is the average duration of a single contact, so it measures the agent's clock rather than the customer's work. In serviceMob engagement data it tracks CSAT at R² 0.0699 and explains 7% of satisfaction. AMPRx counts the minutes across every contact an issue took, which is the customer's side of the clock.
What is the difference between CES, CSAT and NPS?
CES asks how easy an interaction was. CSAT asks how satisfied the customer was with it. NPS asks how likely the customer is to recommend the company. The 2010 Harvard Business Review article that introduced CES presented it as a better predictor of loyalty than satisfaction or Net Promoter Score.
When should you send a Customer Effort Score survey?
After the issue is resolved, if you can tell when that is. A survey after each contact rates the contact, so a customer who needed several contacts rates conversations that hadn't fixed anything yet. Linking contacts into experiences lets you survey once per resolved experience.
What is a good Customer Effort Score?
There is no portable benchmark, because companies use different questions, scales and scoring methods. Compare your score with itself over time and across issue types, and check it against behavioral effort, such as CPRx and AMPRx, for the same customers.